I found this report is very good take what you find helpful in it
=====
QAnon Beliefs and Partisanship
A nontrivial 15% of Americans agree with the sweeping QAnon allegation that “the government, media, and financial worlds in the U.S. are controlled by a group of Satan-worshipping pedophiles who run a global child sex trafficking operation,” while the vast majority of Americans (82%) disagree with this statement. Republicans (23%) are significantly more likely than independents (14%) and Democrats (8%) to agree that the government, media, and financial worlds in the U.S. are controlled by a group of Satan-worshipping pedophiles who run a global child sex trafficking operation.
Similarly, one in five Americans (20%) agree with the statement “There is a storm coming soon that will sweep away the elites in power and restore the rightful leaders,” while a majority (77%) disagree. Nearly three in ten Republicans (28%), compared to 18% of independents and 14% of Democrats, agree with this secondary QAnon conspiracy theory. Trends among demographic groups are similar to those of the core QAnon conspiracy theory.
Fifteen percent of Americans agree that “Because things have gotten so far off track, true American patriots may have to resort to violence in order to save our country,” while the vast majority (85%) disagree. Republicans (28%) are twice as likely as independents (13%) and four times as likely as Democrats (7%) to agree that because things have gotten so far off track, true American patriots may have to resort to violence.
QAnon Beliefs and Media Consumption
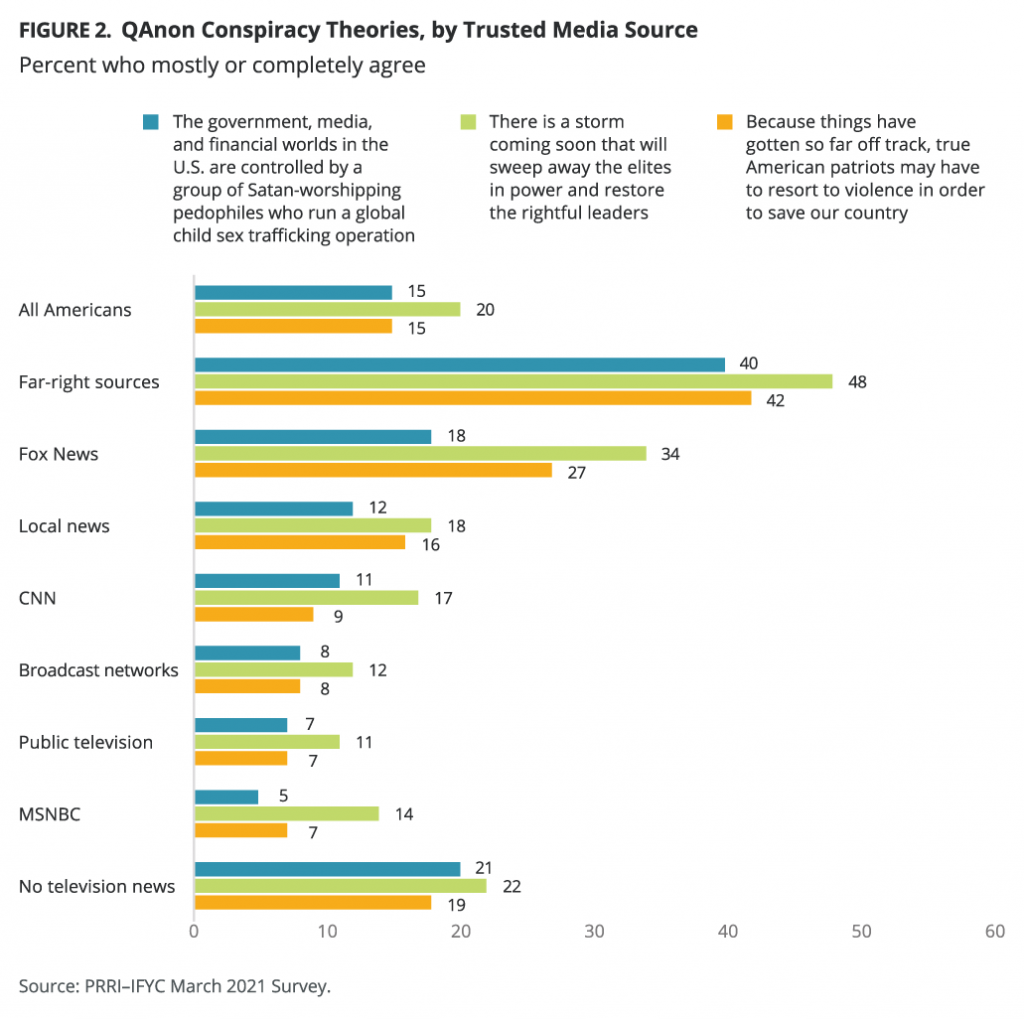
The sources that Americans turn to for news are closely linked with openness to QAnon views. Americans are most likely to say the television news sources they trust most to provide accurate information about politics and current events are the major broadcast networks (17%), such as ABC, CBS, and NBC. One in ten or more report most trusting local television news (13%), Fox News (11%), and CNN (10%). Fewer rely on public television (8%), MSNBC (5%), and far-right news networks (3%) such as One America News Network (OANN) and Newsmax. Three in ten (30%) say that they do not watch television news, and 2% report turning to some other source.
Around four in ten Americans who say they most trust far-right news outlets such as OANN and Newsmax (40%) for television news agree with the statement that “the government, media, and financial worlds in the U.S. are controlled by a group of Satan-worshipping pedophiles who run a global child sex trafficking operation.” Around one in five Americans who do not watch television news (21%) and trust Fox News (18%) agree. Around one in ten Americans or less who trust local news (12%), CNN (11%), broadcast networks such as ABC, CBS, and NBC (8%), public television (7%), and MSNBC (5%) believe this core tenet of QAnon.
Nearly half of Americans who trust far-right news (48%) and one-third who trust Fox News (34%) agree with the statement that “There is a storm coming soon that will sweep away the elites in power and restore the rightful leaders.” About one in five who do not watch television news (22%), those who report trusting local news most (18%), and those who report trusting CNN most (17%) agree with this theory. Fewer Americans who trust MSNBC (14%), broadcast news (12%) or public television (11%) agree.
Around four in ten Americans who most trust far-right news sources (42%) and around one in four who most trust Fox News (27%) agree that “Because things have gotten so far off track, true American patriots may have to resort to violence in order to save our country.” Less than one in five Americans who do not watch television news (19%) or who trust local news (16%) agree, and less than one in ten who trust CNN (9%), broadcast news (8%), public television (7%), or MSNBC (7%) agree.
QAnon Beliefs and Religion
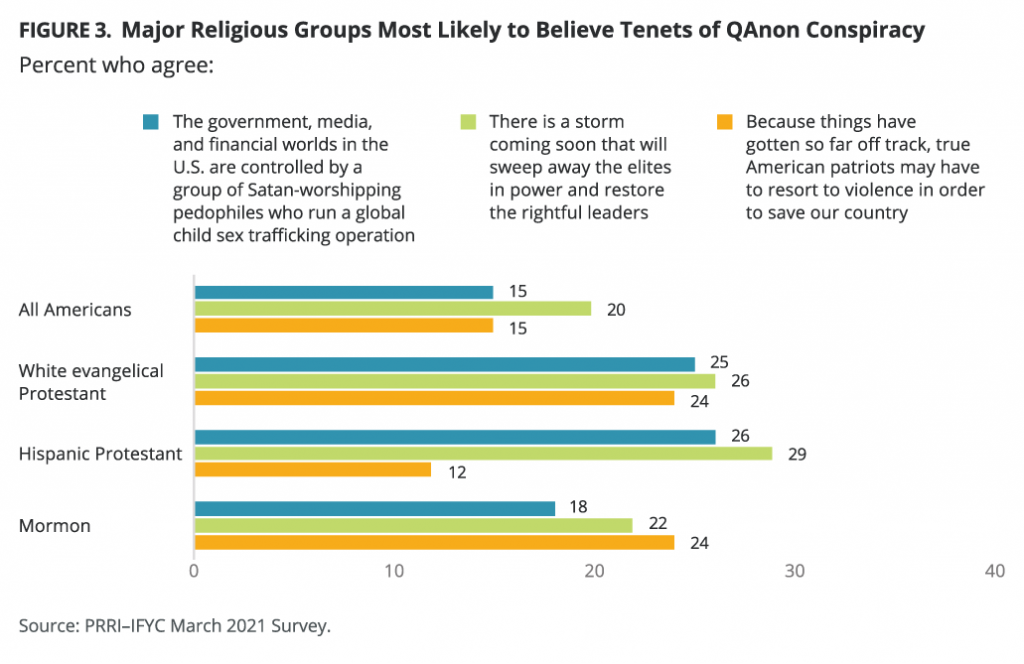
Generally speaking, across all three questions, white evangelical Protestants, Hispanic Protestants, and Mormons are more likely than other groups to agree with each of these tenets of the QAnon conspiracy movement.
Hispanic Protestants (26%), white evangelical Protestants (25%), and other Protestants of color (24%) are more likely than other religious groups to agree that the government, media, and financial worlds in the U.S. are controlled by a group of Satan-worshipping pedophiles who run a global child sex trafficking operation.[1] Less than one in five Mormon (18%), Hispanic Catholic (16%), Black Protestant (15%), other Christian (14%), non-Christian religious (13%), white Catholic (11%), religiously unaffiliated (11%), white mainline Protestant (10%), and Jewish Americans (8%) agree with this statement.[2]
Approximately one in four or more Hispanic Protestants (29%), Hispanic Catholics (27%), white evangelical Protestants (26%), Black Protestants (25%), other Protestants of color (24%), and other Christians (24%) agree that there is a storm coming that will sweep away the elites in power. Fewer Mormons (22%), white Catholics (19%), white mainline Protestants (18%), and members of other non-Christian religions (17%) agree. Religiously unaffiliated (12%) and Jewish Americans (6%) are the least likely to agree with this statement.
With the exceptions of white evangelical Protestants (24%) and Mormons (24%), less than one in five members of all other religious groups agree with this idea, including white mainline Protestants (18%), other Protestants of color (17%), Hispanic Catholics (17%), white Catholics (16%), other Christians (15%), Black Protestants (12%), Hispanic Protestants (12%), religiously unaffiliated Americans (12%), and members of other non-Christian religions (11%). Jewish Americans (6%) are the least likely to agree that true American patriots may have to resort to violence.
A Profile of QAnon Believers
The QAnon Conspiracy Scale
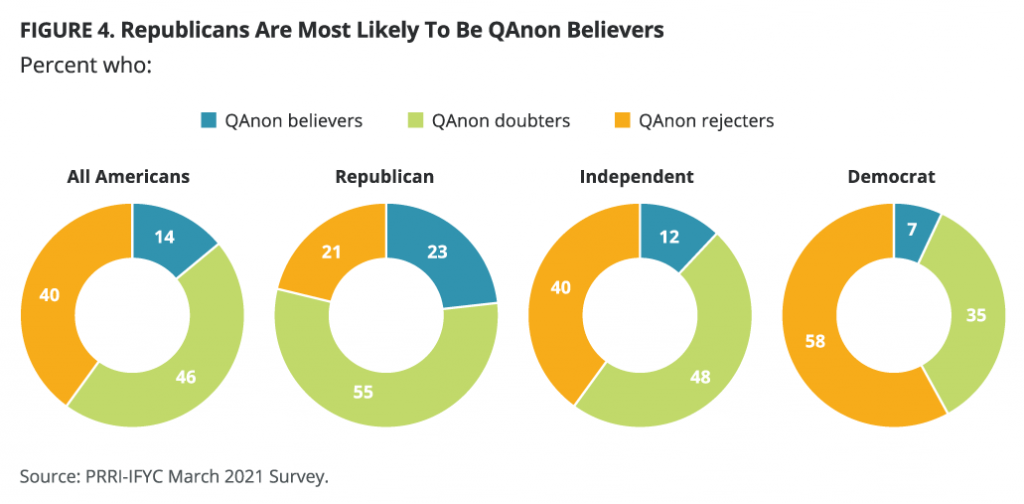
PRRI created a composite measure from the three questions that acknowledge the core tenets of QAnon beliefs. Responses to these questions were combined into an additive scale, which was then recoded into three groups: 1. QAnon believers: Respondents who completely or mostly agreed with these statements (14%); 2. QAnon doubters: Respondents who mostly disagreed with these statements (46%); and 3. QAnon rejecters: Respondents who completely disagreed with all three statements (40%).
Republicans (23%) are notably more likely than independents (12%) and Democrats (7%) to be QAnon believers. A majority of Republicans (55%), nearly half of independents (48%), and over one-third of Democrats (35%) are QAnon doubters. A majority of Democrats (58%) are QAnon rejecters, compared to 40% of independents and 21% of Republicans.
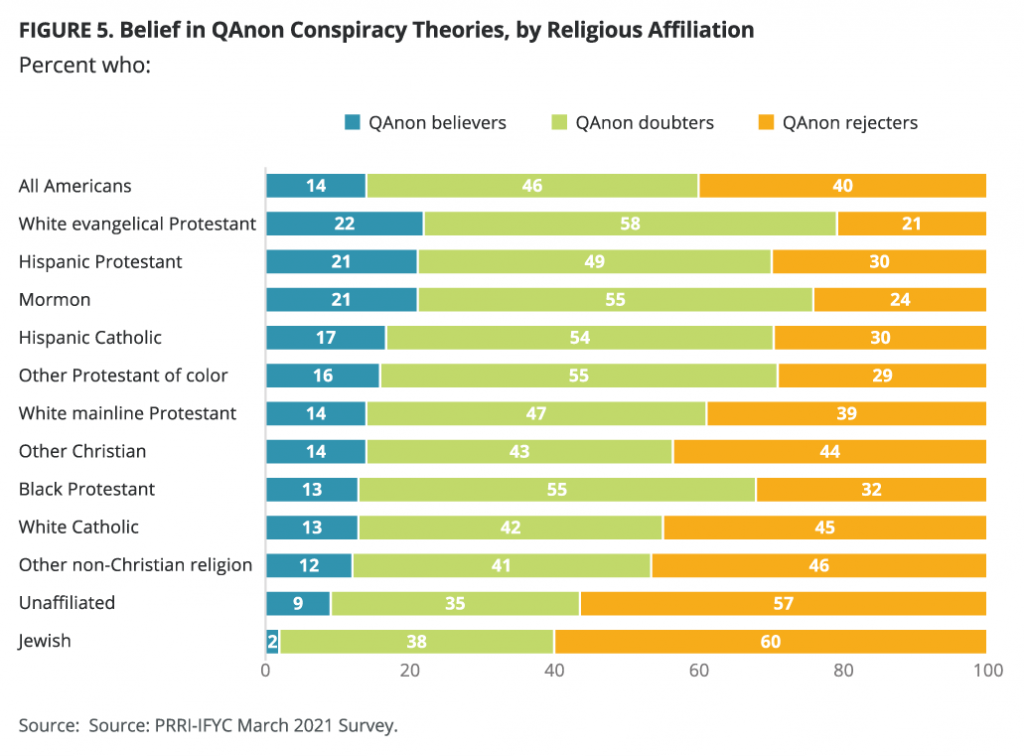
About one in five white evangelical Protestants (22%), Hispanic Protestants (21%), and Mormons (21%) are QAnon believers. Fewer Hispanic Catholics (17%), other Protestants of color (16%), other Christians (14%), Black protestants (13%), white Catholics (13%), and members of non-Christian religions (12%) are QAnon believers. Religiously unaffiliated Americans (9%) and Jewish Americans (2%) are least likely to hold these beliefs.
Conversely, Jewish Americans (60%) and religiously unaffiliated Americans (57%), are the most likely to be QAnon rejecters. Pluralities of members of non-Christian religions (46%), white Catholics (45%), and other Christians (44%) are also QAnon rejecters. Four in ten white mainline Protestants (39%) are QAnon rejecters, as are about three in ten Black Protestants (32%), Hispanic Catholics (30%), Hispanic Protestants (30%), and other Protestants of color (29%). Fewer Mormons (24%) and white evangelical Protestants (21%) are QAnon rejecters. Majorities of white evangelical Protestants (58%), Mormons (55%), other Protestants of color (55%), Black Protestants (55%), and Hispanic Catholics (54%) are QAnon doubters.
Americans without a college education are three times as likely as Americans with a college education to be QAnon believers (18% vs. 6%).
Notably, those who trust far-right news sources most (48%) are by far the most likely to be QAnon believers. One in five of those who most trust Fox News (20%) or do not watch television news (18%) are also QAnon believers, compared to fewer of those who most trust local news (12%), CNN (10%), public television (8%), broadcast networks (5%), or MSNBC (5%).
Americans who trust public television (65%) are most likely to be QAnon rejecters, followed by those who trust MSNBC (60%), broadcast networks (55%), and CNN (51%). About one-third of those who trust local news (35%) and do not watch television news (32%) are QAnon rejecters, compared to only 14% of those who most trust Fox News and 12% of those who most trust far-right sources.
Modeling Those Most Likely to Agree With QAnon Conspiracy Theories
PRRI constructed a logistic regression model to explain which characteristics are independently associated with QAnon conspiracy beliefs. In the table below, the dependent variable is the QAnon believer category from the QAnon Conspiracy Scale above.
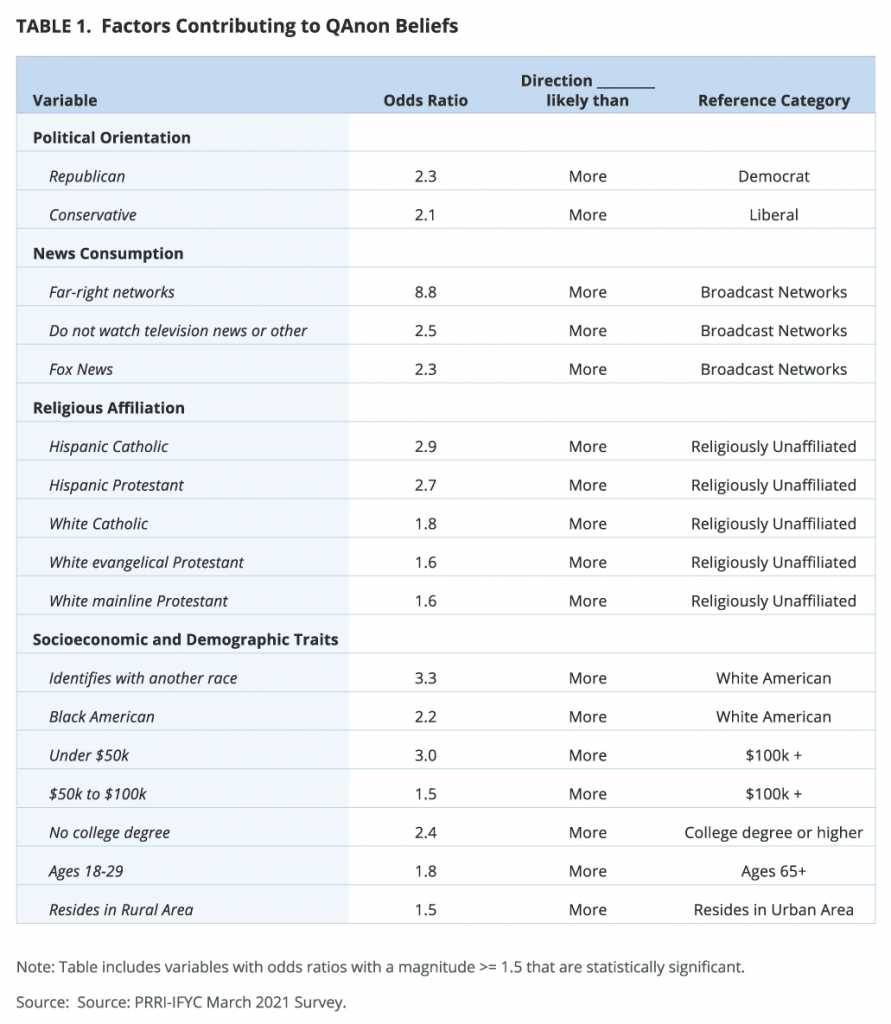
The independent variables are grouped into four categories: political orientation, media consumption, religious affiliation, and socioeconomic and demographic traits. Table 1 shows the statistically significant results.
Interestingly, even after controlling for partisanship and ideology, media news consumption is by far the strongest independent predictor of QAnon beliefs. Remarkably, those who report most trusting far-right media sources are nearly nine times more likely to be QAnon believers compared to those who most trust broadcast networks such as ABC, CBS, and NBC. Those who most trust Fox News and those who do not watch television news are 2.3 and 2.5 times, respectively, more likely than those who watch broadcast networks to be QAnon believers.
Even with a range of controls in place, Republicans and conservatives are twice as likely as Democrats and liberals to be QAnon believers.
Accounting for everything else, Hispanic Catholics (2.9) and Hispanic Protestants (2.7) are about three times more likely than the religiously unaffiliated to be QAnon believers. Similarly, white Catholics (1.8), white evangelical Protestants (1.6), and white mainline Protestants (1.6) are nearly twice as likely as the religiously unaffiliated to be QAnon believers.
Americans of other races and Black Americans are more likely than white Americans to agree with the conspiracy theories, but this is likely due to the fact that race, party, ideology, and religious affiliation are also in the model. Lower education, male gender, lower income, lower age, and living in rural areas are also associated with higher likelihoods of QAnon beliefs.
The Association Between QAnon Beliefs and Other Conspiracy Theories
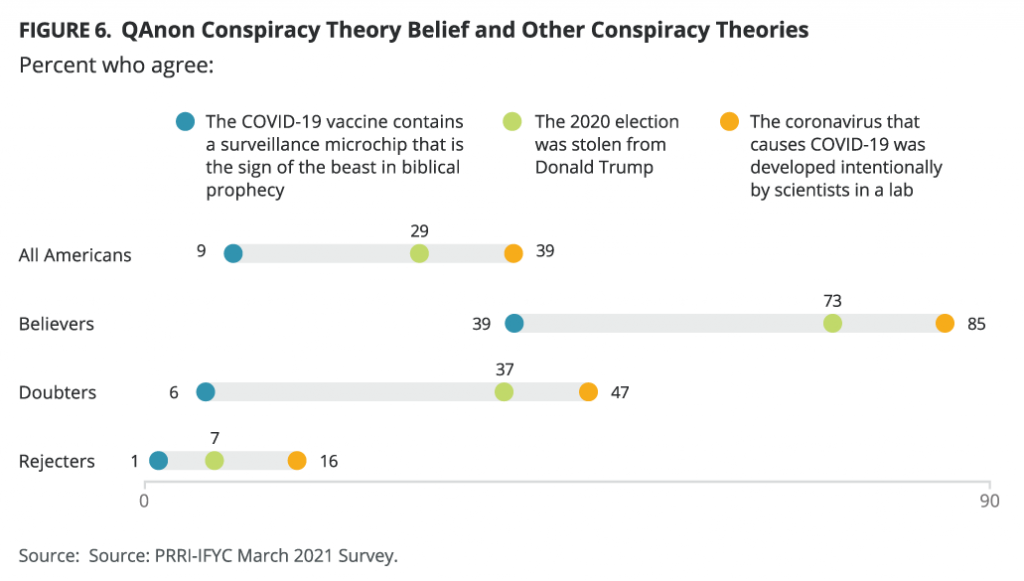
Those who believe in QAnon conspiracy theories are more likely to believe in conspiracy theories generally. While 29% of all Americans agree with the “big lie” that the 2020 presidential election was stolen from Donald Trump, 73% of QAnon believers say this is true. QAnon doubters (37%) are still more likely than average to believe the election was stolen, but only 7% of QAnon rejecters agree that the election was stolen from Trump.
About four in ten Americans (39%) agree that the coronavirus that causes COVID-19 was developed intentionally by scientists in a lab, but 85% of QAnon believers think this. That drops to under half of QAnon doubters (47%) who believe the virus was created intentionally in a lab. Only 16% of QAnon rejecters think the coronavirus was created intentionally.
A small segment of Americans (9%) agree that the COVID-19 vaccine contains a surveillance microchip that is the sign of the beast in biblical prophecy. This figure jumps to 39% among QAnon believers, but only 6% of QAnon doubters and 1% of QAnon rejecters agree.
Survey Methodology and Citations
Methodology
The survey was designed and conducted by PRRI and IFYC among a random sample of 5,149 adults (age 18 and up) living in all 50 states in the United States and who are part of Ipsos’s Knowledge Panel and an additional 476 who were recruited by Ipsos using opt-in survey panels to increase the sample sizes in smaller states. The full sample is weighted to be representative of the U.S. population. Interviews were conducted online between March 8 and 30, 2021.
Respondents are recruited to the KnowledgePanel using an addressed-based sampling methodology from the Delivery Sequence File of the USPS – a database with full coverage of all delivery addresses in the U.S. As such, it covers all households regardless of their phone status, providing a representative online sample. Unlike opt-in panels, households are not permitted to “self-select” into the panel; and are generally limited to how many surveys they can take within a given time period.
The initial sample drawn from the KnowledgePanel was adjusted using pre-stratification weights so that it approximates the adult U.S. population defined by the latest March supplement of the Current Population Survey. Next, a probability proportional to size (PPS) sampling scheme was used to select a representative sample.
To reduce the effects of any non-response bias, a post-stratification adjustment was applied based on demographic distributions from the most recent American Community Survey (ACS). The post-stratification weight rebalanced the sample based on the following benchmarks: age, race and ethnicity, gender, Census division, metro area, education, and income. The sample weighting was accomplished using an iterative proportional fitting (IFP) process that simultaneously balances the distributions of all variables. Weights were trimmed to prevent individual interviews from having too much influence on the final results. In addition to an overall national weight, separate weights were computed for each state to ensure that the demographic characteristics of the sample closely approximate the demographic characteristics of the target populations. The state-level post-stratification weights rebalanced the sample based on the following benchmarks: age, race and ethnicity, gender, education, and income.
These weights from the KnowledgePanel cases were then used as the benchmarks for the additional opt-in sample in a process called “calibration.” This calibration process is used to correct for inherent biases associated with nonprobability opt-in panels. The calibration methodology aims to realign respondents from nonprobability samples with respect to a multidimensional set of measures to improve their representation.
The margin of error for the national survey is +/- 1.5 percentage points at the 95% level of confidence, including the design effect for the survey of 1.4. In addition to sampling error, surveys may also be subject to error or bias due to question wording, context, and order effects. Additional details about the KnowledgePanel can be found on the Ipsos website:
https://www.ipsos.com/en-us/solution/knowledgepanel
Appendix
| Table 1. Demographic, Political, Religious, and Geographic Subgroup Sample Sizes
(Unweighted) |
|
| N= | |
| Total Sample | 5,625 |
| Male | 2,604 |
| Female | 3,021 |
| Republican | 1,656 |
| Independent | 1,746 |
| Democrat | 1,762 |
| Other/Don’t know | 461 |
| White, non-Hispanic | 4,136 |
| Black, non-Hispanic | 480 |
| Hispanic | 602 |
| Multiracial | 167 |
| Other | 240 |
| Age 18-29 | 538 |
| 30-49 | 1,552 |
| 50-64 | 1,742 |
| 65+ | 1,793 |
| White evangelical Protestant | 921 |
| White mainline Protestant | 960 |
| Black Protestant | 329 |
| Hispanic Protestant | 113 |
| Other nonwhite Protestant | 151 |
| White Catholic | 911 |
| Hispanic Catholic | 343 |
| Mormon | 105 |
| Other Christian | 161 |
| Jewish | 139 |
| Other non-Christian religion | 176 |
| Religiously unaffiliated | 1,275 |
| Don’t know/refused | 41 |
[1] “Other Protestant of color” includes all Protestants who are not white, Black, or Hispanic (including Asian American or Pacific Islander, multiracial, Native American, and any other race or ethnicity). Categories were combined due to sample size limitations.
[2]“Other Christian” includes all Christians who are not specified in any other category, including Catholics who are Black, Asian American or Pacific Islander, multiracial, Native American, and any other race or ethnicity; Jehovah’s Witnesses; Orthodox Christians; and any other Christian group. “Other non-Christian religion” includes those who are Muslim, Hindu, Buddhist, Unitarian Universalist, and any other world religion. Categories were combined due to sample size limitations.

I don’t think the title of your article matches the content lol. Just kidding, mainly because I had some doubts after reading the article. https://www.binance.com/bg/register?ref=P9L9FQKY
Thank you for your sharing. I am worried that I lack creative ideas. It is your article that makes me full of hope. Thank you. But, I have a question, can you help me?
Wow, incredible blog format! How lengthy have you ever been running a blog for?
you made running a blog look easy. The overall look of your website is great, as
smartly as the content! You can see similar here sklep
Wow, amazing weblog layout! How long have you ever been blogging for?
you make blogging glance easy. The total look of your website is great, as smartly
as the content material! You can see similar here sklep internetowy
Wow, amazing weblog format! How lengthy have you ever been running
a blog for? you made blogging glance easy. The entire glance of your website is great, as neatly as the content material!
You can see similar here sklep online
Very interesting points you have observed, thanks for posting.Raise blog range